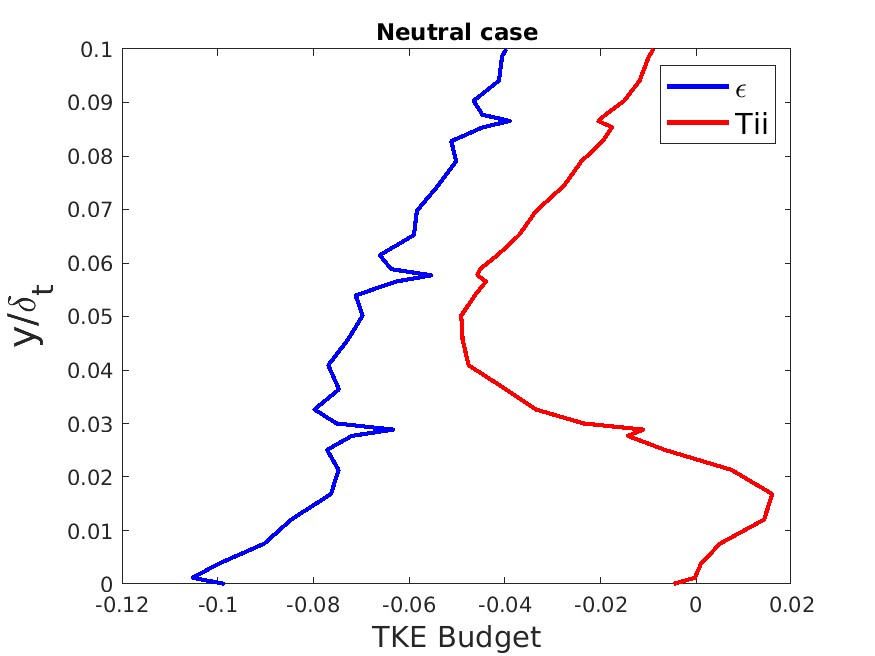
******************* This email originates from outside Imperial. Do not click on links and attachments unless you recognise the sender. If you trust the sender, add them to your safe senders list https://spam.ic.ac.uk/SpamConsole/Senders.aspx to disable email stamping for this address. ******************* Dear All, Hope everyone is doing well! We keep seeing wiggles in our time- and plane-averaged profile for the turbulent dissipation rate \epsilon obtained from Nektar++ DNS results, as shown in the attached plot. They seem to appear whenever calculating profiles of second or higher order flow statistics involving velocity gradients, whereas the time-averaged flow profiles themselves look alright. From earlier posts, it seems that similar issues have also been reported by other users. Is there a way to alleviate the issue either through adapting the simulation or the postprocessing procedure, i.e. smoothing? Best regards, Cheng
Hi Cheng, As you mention we had a previous discussion on this topic. I think the issue is that we are not dealiaising the statistics when calculating the Reynolds stresses. So ideally we need to write and process them at a higher number of quadrature points and that will hopefully make it more accurate and smoother. I think others have had to write many output files and then post-process these files which unfortunately takes a lot of disk space. Best, Spencer. From: nektar-users-bounces@imperial.ac.uk <nektar-users-bounces@imperial.ac.uk> on behalf of Xiao, Chengnian <CHX33@pitt.edu> Date: Wednesday, 25 September 2024 at 02:03 To: nektar-users <nektar-users@imperial.ac.uk> Subject: [Nektar-users] Wiggles in turbulent dissipation rate profile This email from CHX33@pitt.edu originates from outside Imperial. Do not click on links and attachments unless you recognise the sender. If you trust the sender, add them to your safe senders list<https://spam.ic.ac.uk/SpamConsole/Senders.aspx> to disable email stamping for this address. Dear All, Hope everyone is doing well! We keep seeing wiggles in our time- and plane-averaged profile for the turbulent dissipation rate \epsilon obtained from Nektar++ DNS results, as shown in the attached plot. They seem to appear whenever calculating profiles of second or higher order flow statistics involving velocity gradients, whereas the time-averaged flow profiles themselves look alright. From earlier posts, it seems that similar issues have also been reported by other users. Is there a way to alleviate the issue either through adapting the simulation or the postprocessing procedure, i.e. smoothing? Best regards, Cheng
participants (2)
-
Sherwin, Spencer J
-
Xiao, Chengnian