Dear all, I know it is more a paraview question than firedrake, but the question is about how to visualize the data using paraview. The documentation on the firedrake website is quite succinct and does not tell anything about the User Interface of Paraview, which is fine. But I do not know how to get pictures and I wonder where the error lies. If I run some example, like say, Camassa-Holm I obtain a sequence of .vtu files. When opening with paraview 5.8.1 the files u.pvd or u_0.pvd I obtain the image in attachment. The image points out to several errors: "Number of cells: 0" "Number of points: 0" "X range: not available" "Y range: not available" "Z range: not available" So clearly some grid is missing somewhere but I do not know how to provide it. Would it be possible to provide some basic information on how to use paraview on the vtu files? Alternatively, since Paraview is scriptable, I would very much appreciate having a python script for creating output from paraview (such as the double-slit youtube video) in one of the tutorial test cases. Thank you very much in advance for any help, Mathieu
Hi, Mathieu. Did you see the link bellow? I've found it very useful. https://www.firedrakeproject.org/visualisation.html Regards Em qui, 1 de out de 2020 10:34, Mathieu Dutour <mathieu.dutour@gmail.com> escreveu:
Dear all, I know it is more a paraview question than firedrake, but the question is about how to visualize the data using paraview.
The documentation on the firedrake website is quite succinct and does not tell anything about the User Interface of Paraview, which is fine. But I do not know how to get pictures and I wonder where the error lies.
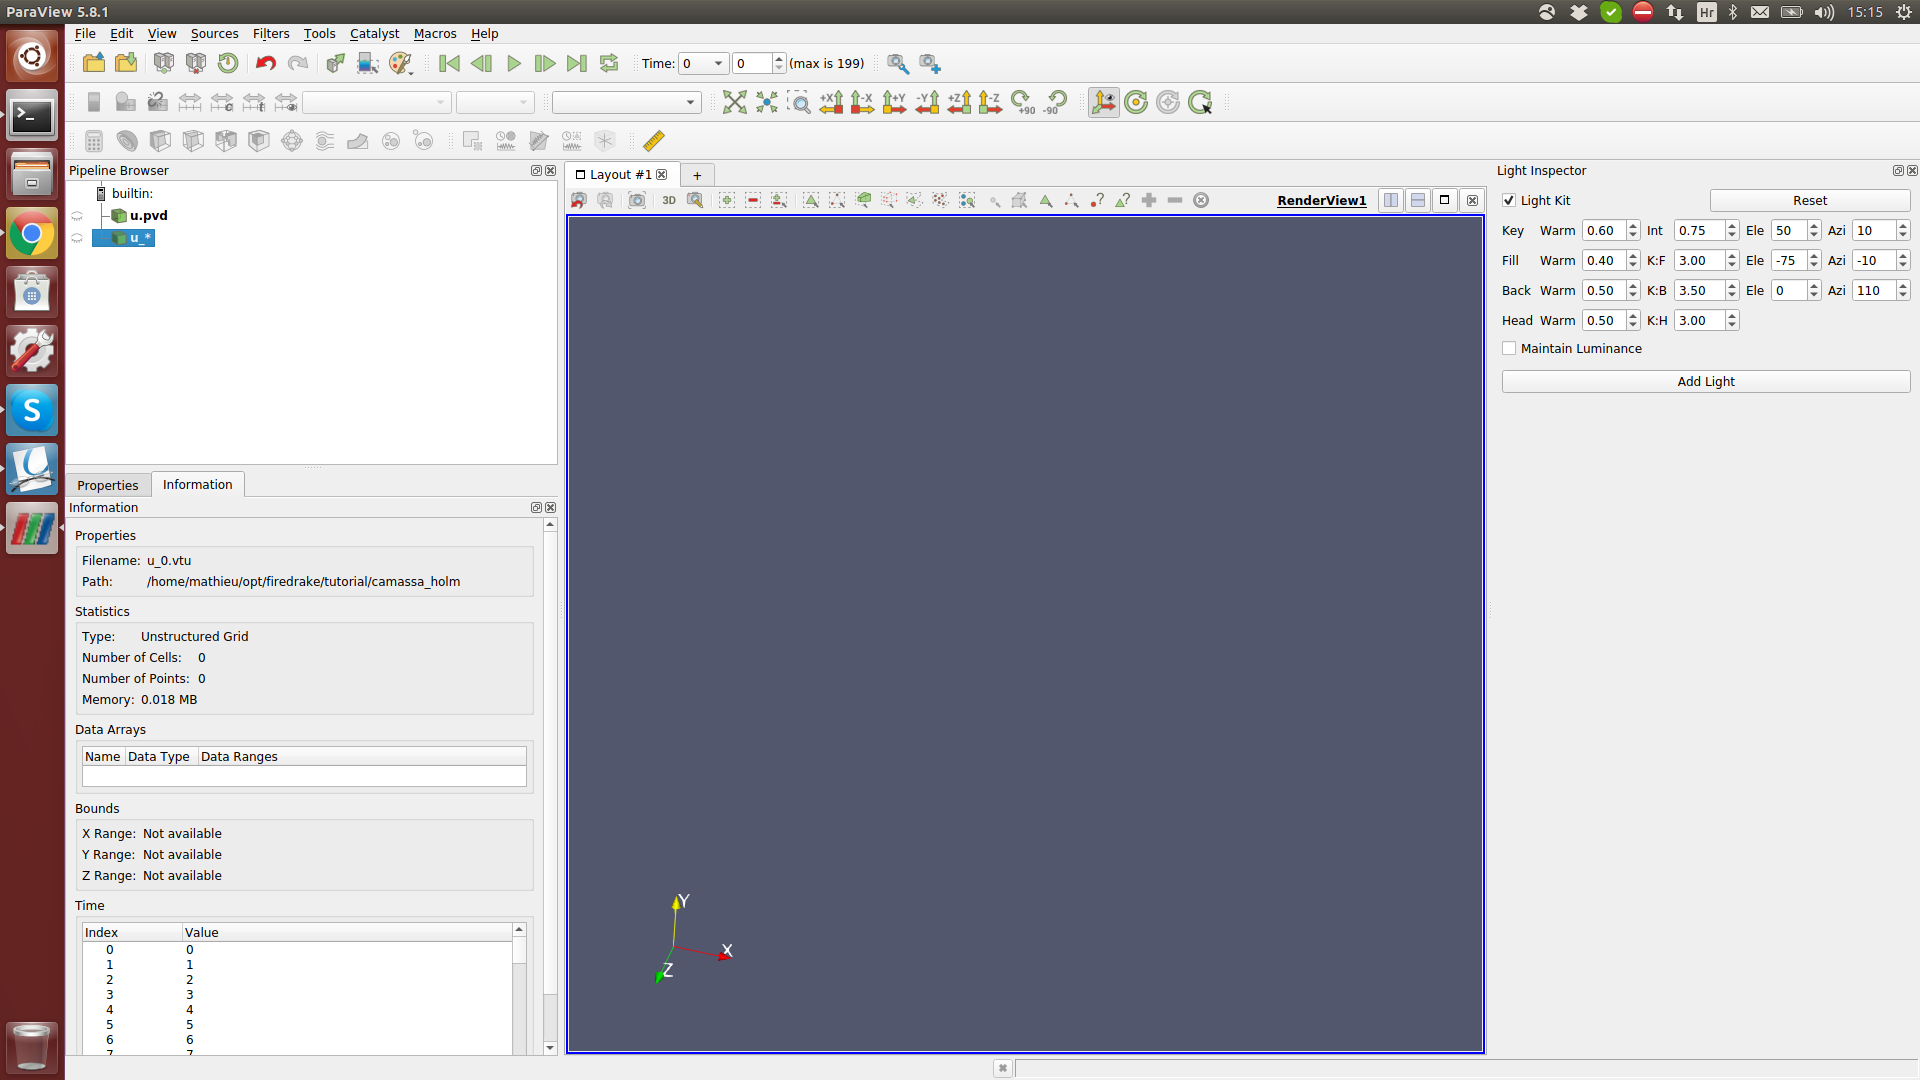
If I run some example, like say, Camassa-Holm I obtain a sequence of .vtu files. When opening with paraview 5.8.1 the files u.pvd or u_0.pvd I obtain the image in attachment.
The image points out to several errors: "Number of cells: 0" "Number of points: 0" "X range: not available" "Y range: not available" "Z range: not available" So clearly some grid is missing somewhere but I do not know how to provide it. Would it be possible to provide some basic information on how to use paraview on the vtu files?
Alternatively, since Paraview is scriptable, I would very much appreciate having a python script for creating output from paraview (such as the double-slit youtube video) in one of the tutorial test cases.
Thank you very much in advance for any help,
Mathieu _______________________________________________ firedrake mailing list firedrake@imperial.ac.uk https://mailman.ic.ac.uk/mailman/listinfo/firedrake
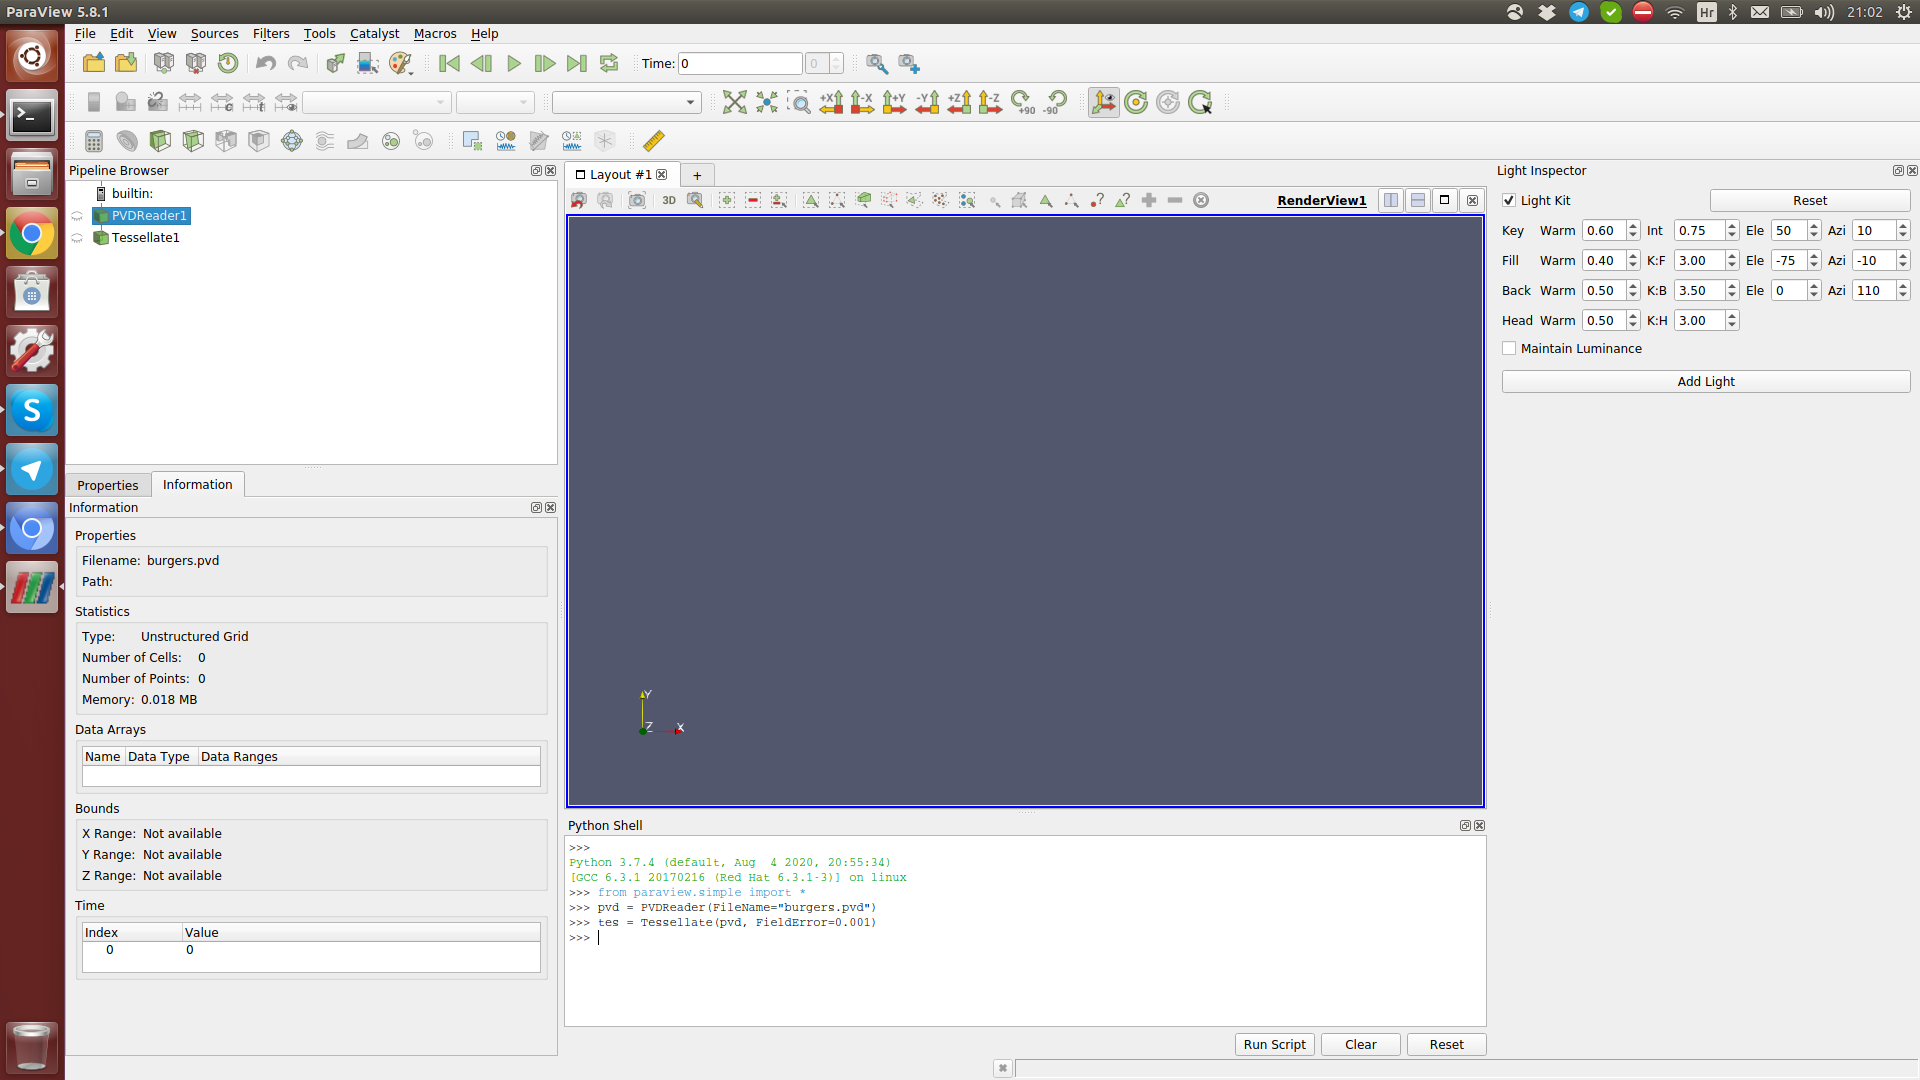
Hi Rodrigo, yes I saw that web page. I understand how it is supposed to work on the Python side, but the paraview remains mysterious. I can't manage to find how to get the information plotted. I use the burgers test case and the code is the same on that web page. The vtu files are created but I can't get them plotted. The web page contains some information on the python shell but if I use them, I cannot get anything plotted. See the image in attachment. Mathieu On Thu, 1 Oct 2020 at 22:06, Rodrigo Piccinini <rbpiccinini@gmail.com> wrote:
Hi, Mathieu.
Did you see the link bellow? I've found it very useful.
https://www.firedrakeproject.org/visualisation.html
Regards
Em qui, 1 de out de 2020 10:34, Mathieu Dutour <mathieu.dutour@gmail.com> escreveu:
Dear all, I know it is more a paraview question than firedrake, but the question is about how to visualize the data using paraview.
The documentation on the firedrake website is quite succinct and does not tell anything about the User Interface of Paraview, which is fine. But I do not know how to get pictures and I wonder where the error lies.
If I run some example, like say, Camassa-Holm I obtain a sequence of .vtu files. When opening with paraview 5.8.1 the files u.pvd or u_0.pvd I obtain the image in attachment.
The image points out to several errors: "Number of cells: 0" "Number of points: 0" "X range: not available" "Y range: not available" "Z range: not available" So clearly some grid is missing somewhere but I do not know how to provide it. Would it be possible to provide some basic information on how to use paraview on the vtu files?
Alternatively, since Paraview is scriptable, I would very much appreciate having a python script for creating output from paraview (such as the double-slit youtube video) in one of the tutorial test cases.
Thank you very much in advance for any help,
Mathieu _______________________________________________ firedrake mailing list firedrake@imperial.ac.uk https://mailman.ic.ac.uk/mailman/listinfo/firedrake
participants (2)
-
Mathieu Dutour
-
Rodrigo Piccinini