11 Dec
2015
11 Dec
'15
12:33 p.m.
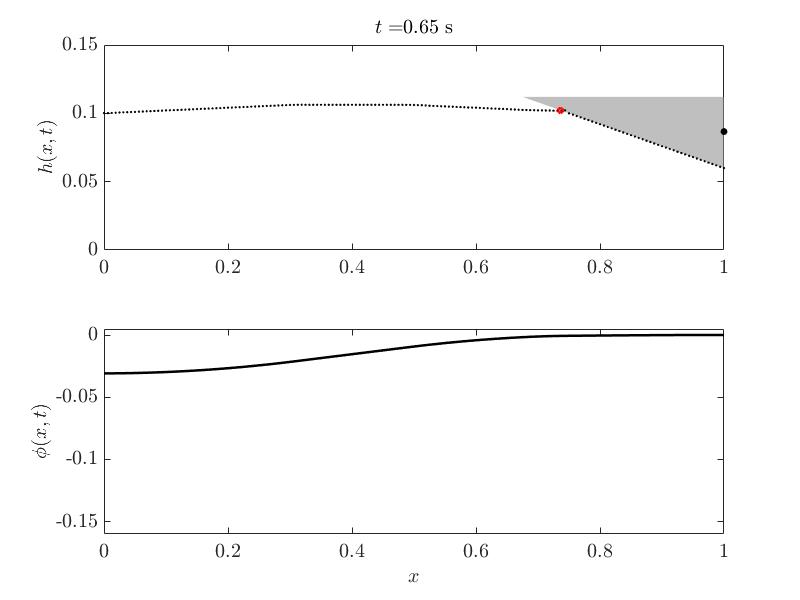
Dear all, I have a question which is related to visualising results with Paraview, so I thought maybe someone here can help. I would like to plot the coordinates (x,y) of specific point (similar to the red circle in the picture attached) on the same plot as the solution. These coordinates change at every time step and I can calculate them as save them in a .csv file, which I can load to Paraview. However, I don't know which filters I need to apply in order to create the desired outcome. Any ideas would be appreciated. Thanks! Best, Anna.